Data Visualization Techniques for Enhanced User Insights
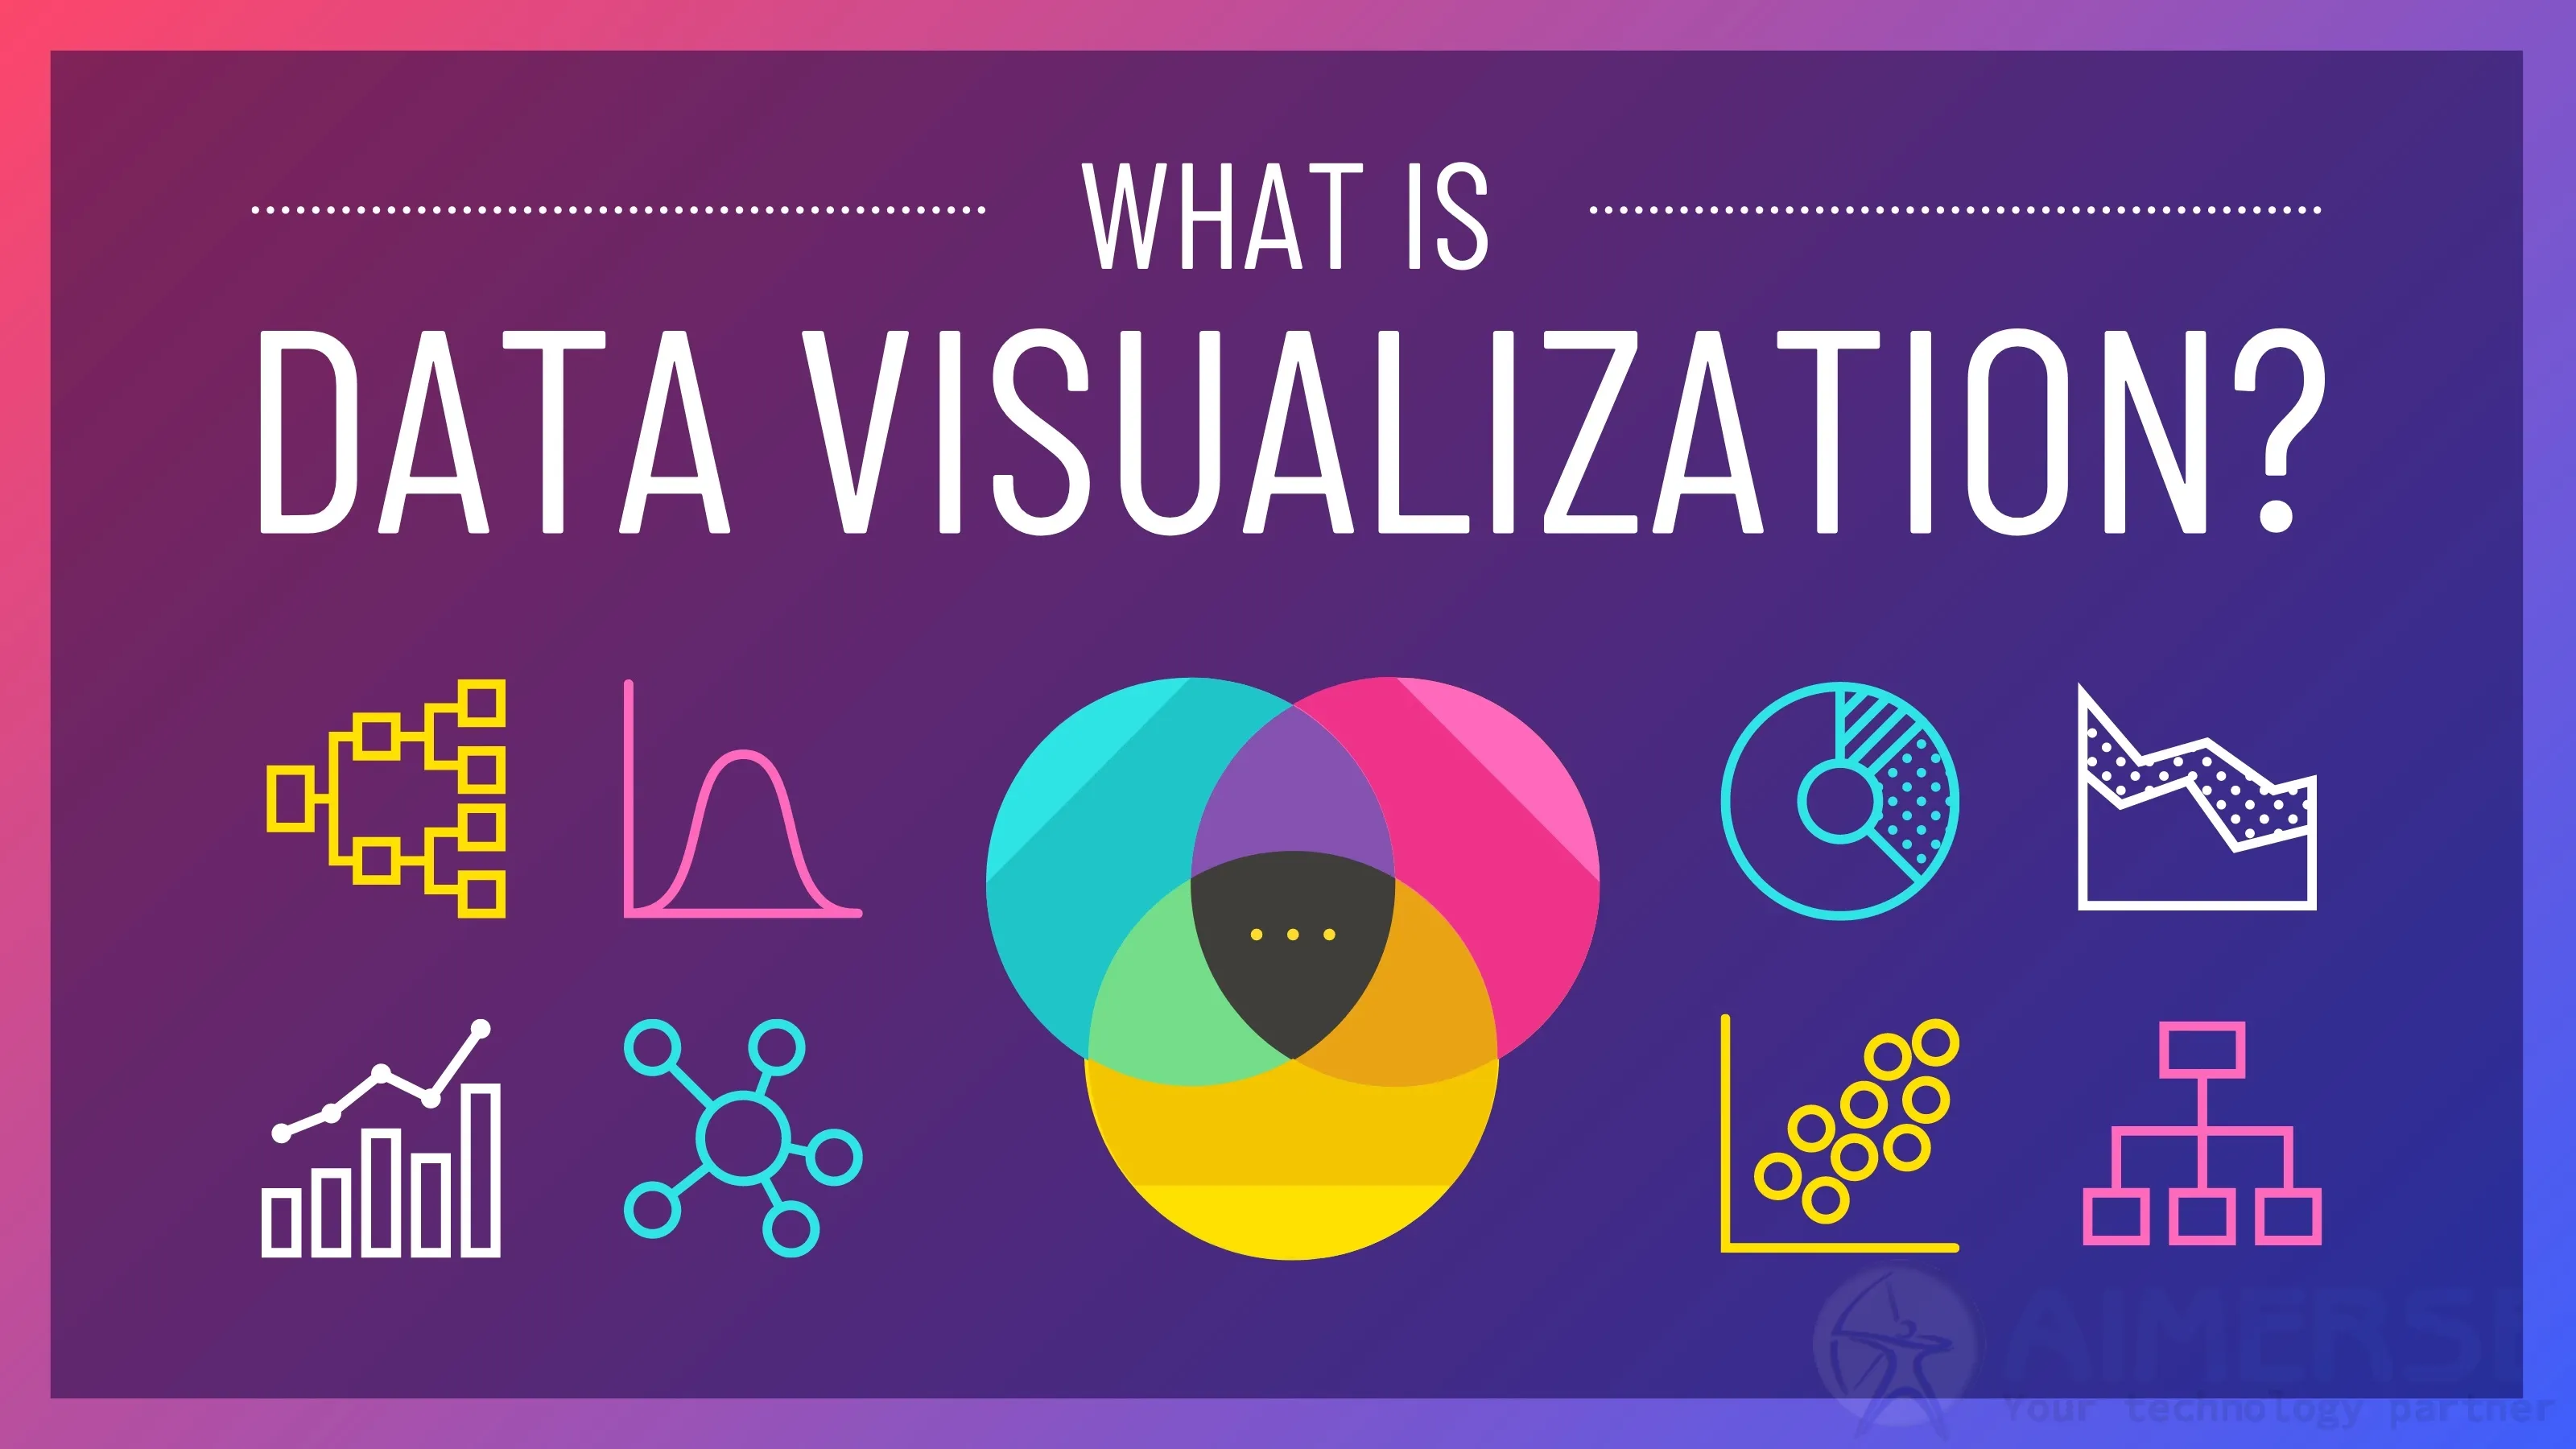
In today's data-driven world, the ability to interpret and present data appropriately presents an imperative step to informed decision-making. Data visualization represents the gap between an array of complex data sets and actionable insights built toward enabling the understanding of patterns, trends, and correlations hidden in raw data. On application with proper techniques, organizations can improve user understanding and strategic actions.
Common Data Visualization Techniques
-
Bar Charts:
- Purpose: compare quantities across different categories.
- Use Case: Sales quantity in different areas
-
Line Charts:
- Purpose: For overtime trend
- Use Case: Monitoring website traffic for a month
-
Pie Charts:
- Purpose: For part of a whole
- Use Case: Market share
-
Heat Maps:
- Purpose: To show the density or intensity of data
- Use Case: showing user interaction on a web page
-
Scatter Plots:
- Purpose: When to use two variables to analyze a relationship
- Use Case: Reveal how the expenditure on advertisement and sales are related
Advanced Visualization Techniques
-
Histograms:
- Purpose: To utilize the distribution of data.
- Use Case: Customer purchase amounts frequency.
-
Box and Whisker Plots:
- Purpose: Use of box and whisker plots: to show data distribution and any outliers.
- Use Case: Score test results over several classrooms
-
Gantt Charts
- Purpose: Use of Gantt charts: plan and keep track of projects.
- Use case: Managing your project schedule, and deadline.
-
Network Diagrams
- Purpose: Use of Network Diagrams to Show the association between entities
- Use Case: Social connections in social networks
Best Practice in Data Visualization
- Know your audience: design the graph for the reader's expertise and requirements.
- Choose the Right Chart Type: Select visualization methods that best represent the data and insights.
- Simplify and Focus: Avoid clutter by emphasizing key information and removing unnecessary elements.
- Use Color Wisely: Employ color to highlight important data points but be mindful of accessibility considerations.
- Provide Context: Include labels, legends, and explanations to ensure clarity.
Conclusion
Effective data visualization transforms complex data into actionable and clear insights, enabling better understanding and decision-making. Proper visualization techniques and best practices for use in organizations will engage users and propel strategic success.
Custom Software Development Technologies Used React.js, Node.js, Python Django, Laravel, Java Spring Boot At Aimerse Technologies we create custom software tailored to the specific needs of our clients. Therefore, we can create extremely visually intuitive data visualization products that can help users with certain decisions based on clear and perceptive data representation.
